

Contents:
- The 2026 League Matrix: Analytical Audit & xG Performance Strategies
- The Analytical Pivot: How Professionals Read a League
- The Physics of the Season: Schedules and Fatigue
- Statistics vs. Reality: The "Noise" in the Numbers
- The Big 6: 2026 Tactical Archetypes
- Expert Verdict: Prioritize Underlying Metrics over Club Reputation to find market value
- The Hidden Bias: Why Human Eyes Still Catch What Data Misses
- Responsible Analytics
The 2026 League Matrix: Analytical Audit & xG Performance Strategies
In 2026, football leagues are no longer just "schedules"—they are massive data ecosystems. I know the feeling of watching a team dominate xG in 3 consecutive games but still fail to win any. While a knockout cup rewards a "hot streak," a league title is a statistical validation of sustainable performance over time, over 3,420 minutes of football.
To know more about any league, you must understand the Performance Differentials. We don't just look at who is 1st; we look at whose Expected Points (xPTS) match their actual position. This is how we separate "lucky" leaders from sustainable champions.

The Analytical Pivot: How Professionals Read a League
Most fans see a narrative; we see Regression to the Mean. When a mid-table team wins five games in a row, the casual observer calls it "momentum." The analyst checks the Expected Goals (xG) against. If they conceded 10 big chances but let in 0 goals, we know a correction is coming.
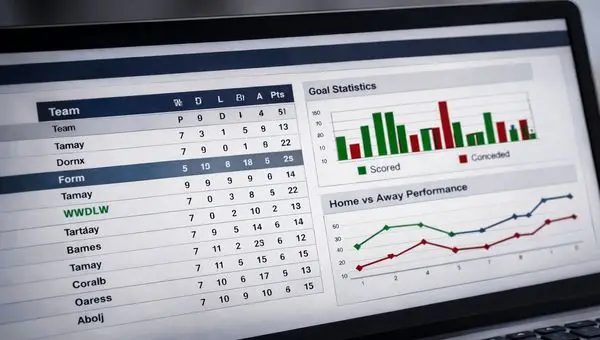
Analyst Insight: In 2026, the most underrated metric is PPDA (Passes Per Defensive Action). It shows which teams control the tempo through pressing and which are lucky to counter-attack.
The Physics of the Season: Schedules and Fatigue
The 2026 football calendar is more congested than ever. Fixture order is now a primary performance variable. We track "Rest Advantage"—the hours of recovery one team has over another before a league clash.
- Early Season (Rounds 1-10): That's the moment when the head coaches feel that they can experiment with the squad and find the best players.
- The "Winter Grind": If the manager lacks depth during that time, it can ruin the whole season.
- The Survival Phase: Always be careful near the end of the campaign, as teams fighting for survival count on other things, such as fighting and spirit, and can win games that, on paper and statistically, are impossible.
Statistics vs. Reality: The "Noise" in the Numbers
A league table can lie for months. To obtain a more objective performance profile, we audit the following metrics:
| Metric | Standard Interpretation | The Professional Lens |
|---|---|---|
| Points Total | Direct measure of quality. | Often skewed by late-goal variance. |
| Goal Difference | Attacking vs Defensive power. | Should be compared against Non-Penalty xG. |
| Home/Away Split | Home advantage factor. | Measure of psychological resilience and travel fatigue. |
| Top Scorers | Best players in the league. | Measure of "Shot Quality" and chance creation efficiency. |
In the past, that was the trademark of teams like Sir Alex Ferguson’s Manchester United – those classic runs where you just knew that no matter what the xG stats said, they would grind out a win purely on raw grit and habit.
The Big 6: 2026 Tactical Archetypes
Each major European league now operates with a distinct Statistical Identity. Understanding these "League Personalities" is essential for accurate modeling.
England – The High-Intensity Hub
The Premier League remains the global leader in physical output. In 2026, the gap between the "Big 6" and the rest has narrowed due to massive TV revenue, making "Away at a promoted side" a genuine statistical trap. That allows even the teams at the bottom of the Premier League standings to afford huge transfer sums comparable to those of the top clubs in other leagues.
Italy – The Tactical Laboratory
Modern Serie A has shed its "defensive only" label. It is now the league with the most sophisticated Build-up play. We track "Line-breaking passes" here more than anywhere else. Matches often start like a cautious chess match that might test a neutral's patience in the first half, but the script flips completely after the break once the tactical shackles come off.
Germany – The Verticality Kings
The Bundesliga is the home of Transition Football. High goal averages are the norm, but so is high xG volatility. It’s the best league for analyzing offensive efficiency. Still the most relentless attacking league in Europe, where pure spectacle and goal feasts are a given because these teams simply refuse to put the handbrake on.
Spain – Technical Possession
In LaLiga, "Time on Ball" is still a defensive strategy. Low-block defenses here are among the most disciplined in the world, leading to fewer total goals but higher technical quality. However, keep in mind that an away match vs. a small team in November can be a trap because of the country's varied weather conditions.
France – The Athletic Factory
Ligue 1 is now the global benchmark for Physical Profiling. It is a high-duel, high-contact league where individual brilliance often breaks tactical deadlocks. Still, one team dominates it, but almost all young talents across Europe come from teams in the French league.
Netherlands – The Developmental Engine
The Eredivisie is where we look for the "Next Gen" tactics. High-line defenses and aggressive pressing make this league a goldmine for analyzing attacking patterns. It is fun to watch for people who enjoy attacking football and to see the next big star while still playing in the Dutch league.
Expert Verdict: Prioritize Underlying Metrics over Club Reputation to find market value
My final advice for 2026: A club’s reputation can be a lagging indicator, whereas underlying metrics often serve as leading indicators of future form. A "giant" in crisis often has a positive xG but poor finishing—this is where the value lies for those who can read the data before the market adjusts.
Expert Verdict: League tables are lagging indicators. Advanced metrics (xG, xPTS, PPDA) are leading indicators. To project a team’s potential trajectory in the standings, prioritize Chance Creation Quality over recent scorelines.
The Hidden Bias: Why Human Eyes Still Catch What Data Misses
You can't just rely on cold data to crack the markets. If spreadsheets had all the answers, bookmakers would have gone bankrupt years ago given today's heavy-duty AI models. But football will never fit neatly into an algorithm – and that's exactly why we're obsessed with it. It's living chaos, where the underdog can rip up the form book purely on passion and momentum.
The real edge comes from watching the game with your own eyes: catching a player's body language dropping, spotting the exhaustion in a manager's eyes during post-match interviews, or feeling that raw stadium atmosphere that algorithms just can't quantify. Sure, xG gives you a brilliant backbone, but the human eye is what separates a guess from a proper read.
Responsible Analytics

Maths is awesome, but football still remains chaos, and it can't always be predicted. Even the best statistical model cannot account for a 90th-minute red card or a deflected shot. Treat every league round as a single data point in a much larger 38-game study.